Isochrone API

Introduction

An isochrone represents a path that joins all the points with the same travel time or travel distance from a specific point of reference. NextBillion.ai’s Isochrone API calculates the regions that can be reached within a designated time frame from a given location. It returns these accessible areas as contours of polygons or lines, which can be conveniently displayed on a map. Additionally, this API also enables the creation of contours based on distance. With the Isochrone API users can easily define serviceable areas or delivery zones based on travel times from a starting location

The Isochrone API can be accessed through the HTTPS GET method. Let’s take a look at the features and properties of this service.


GET

https://api.nextbillion.io/isochrone/json?key={your_api_key}

Request Parameters

Loading..

Response Schema

Loading..

Sample Queries

GET Request Example 1

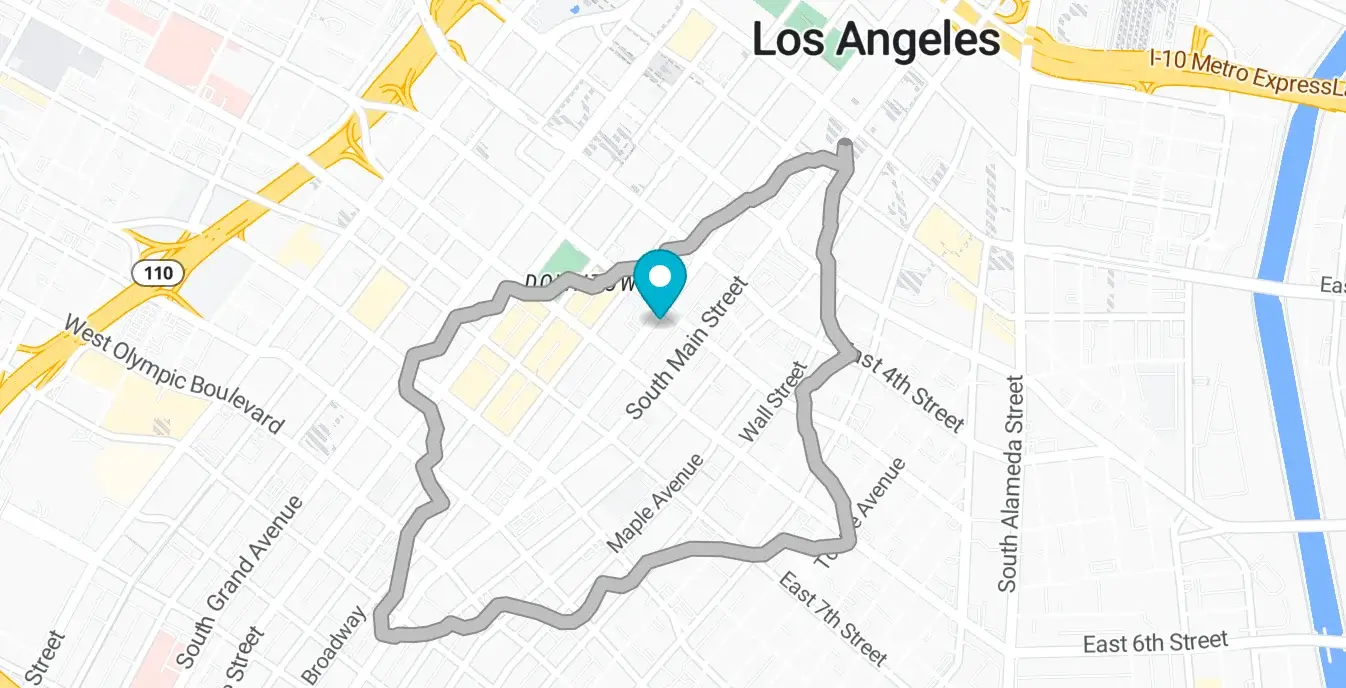
Let’s build a basic Isochrone API request to determine the area that a car can cover within a driving time of 20 minutes when a given coordinates is the starting point.

Request

curl --location 'https://api.nextbillion.io/isochrone/json?key=<your_api_key>&coordinates=34.04715844,-118.24977187&mode=car&contours_minutes=5'

Response

1
2
3
4
5
6
7
8
9
10
11
12
13
14
15
16
17
18
19
20
21
22
23
24
25
26
27
28
29
30
31
32
33
34
35
36
37
38
39
40
41
42
43
44
45
46
47
48
49
50
51
52
53
54
55
56
57
58
59
60
61
62
63
64
65
66
67
68
69
70
71
72
73
74
75
76
77
78
79
80
81
82
83
84
85
86
87
88
89
90
{
    "features": [
        {
            "properties": {
                "fill": "#bf4040",
                "fillOpacity": 0.33,
                "fillColor": "#bf4040",
                "color": "#bf4040",
                "contour": 5.0,
                "opacity": 0.33,
                "metric": "time"
            },
            "geometry": {
                "coordinates": [
                    [
                        -118.243772,
                        34.051682
                    ],
                    [
                        -118.243842,
                        34.051229
                    ],
                    [
                        -118.24562,
                        34.051158
                    ],
                    [
                        -118.24873,
                        34.049117
                    ],
                    [
                        -118.249564,
                        34.048951
                    ],
                    [
                        -118.249709,
                        34.048158
                    ],
                    [
                        -118.25045,
                        34.048481
                    ],
                    [
                        -118.251968,
                        34.047962
                    ],
                    [
                        -118.254772,
                        34.047939
                    ],
                    [
                        -118.255051,
                        34.047438
                    ],
                    [
                        -118.256379,
                        34.047158
                    ],
                    [
                        -118.256921,
                        34.046308
                    ],
                    [
                        -118.257736,
                        34.046122
                    ],
                    [
                        -118.257971,
                        34.045158
                    ],
                    [
                        -118.257007,
                        34.044158
                    ],
                    [
                        -118.243725,
                        34.051112
                    ],
                    [
                        -118.243772,
                        34.051682
                    ]
                ],
                "type": "LineString"
            },
            "type": "Feature"
        }
    ],
    "type": "FeatureCollection"
}

Here is how the above response looks on a map. We can easily visualize the area reachable within 20 minutes. It is enclosed by a contour line or a polygon around the starting point provided in the coordinates parameter

isochrone example 1

GET Request Example 2

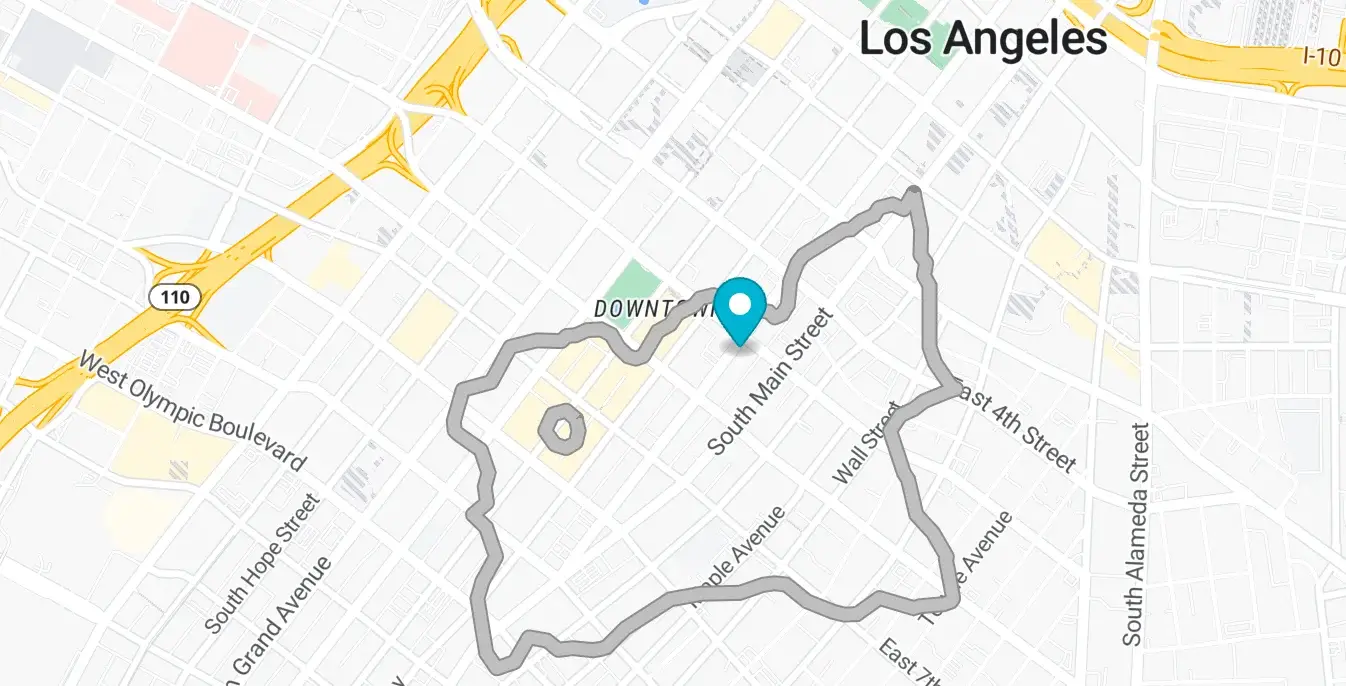
Taking the next step for the same coordinates point and same contour_minutes value, let’s expand the request to configure the following parameters:

  • set mode = truck to see what areas can a truck cover

  • set denoise to a low value to receive exact pockets of areas that can or cannot be covered within the given time

Request

curl --location 'https://api.nextbillion.io/isochrone/json?key=<your_api_key>&coordinates=34.03849472,-118.24424250&mode=truck&contours_minutes=5&denoise=0.001'

Response

1
2
3
4
5
6
7
8
9
10
11
12
13
14
15
16
17
18
19
20
21
22
23
24
25
26
27
28
29
30
31
32
33
34
35
36
37
38
39
40
41
42
43
44
45
46
47
48
49
50
51
52
53
54
55
56
57
58
59
60
61
62
63
64
65
66
67
68
69
70
71
72
73
74
75
76
77
78
79
80
81
82
83
84
85
86
87
88
89
90
91
92
93
94
95
96
97
98
99
100
101
102
103
104
105
106
107
108
109
110
111
{
    "features": [
        {
            "properties": {
                "fill": "#bf4040",
                "fillOpacity": 0.33,
                "fillColor": "#bf4040",
                "color": "#bf4040",
                "contour": 5.0,
                "opacity": 0.33,
                "metric": "time"
            },
            "geometry": {
                "coordinates": [
                    [
                        -118.244772,
                        34.050702
                    ],
                    [
                        -118.247946,
                        34.049333
                    ],
                    [
                        -118.248772,
                        34.047859
                    ],
                    [
                        -118.250562,
                        34.048369
                    ],
                    [
                        -118.246772,
                        34.040776
                    ],
                    [
                        -118.245772,
                        34.041169
                    ],
                    [
                        -118.243697,
                        34.041084
                    ],
                    [
                        -118.243819,
                        34.042158
                    ],
                    [
                        -118.244694,
                        34.043158
                    ],
                    [
                        -118.245452,
                        34.045158
                    ],
                    [
                        -118.243559,
                        34.046158
                    ],
                    [
                        -118.244317,
                        34.047158
                    ],
                    [
                        -118.244772,
                        34.050702
                    ]
                ],
                "type": "LineString"
            },
            "type": "Feature"
        },
        {
            "properties": {
                "fill": "#bf4040",
                "fillOpacity": 0.33,
                "fillColor": "#bf4040",
                "color": "#bf4040",
                "contour": 5.0,
                "opacity": 0.33,
                "metric": "time"
            },
            "geometry": {
                "coordinates": [
                    [
                        -118.254488,
                        34.045442
                    ],
                    [
                        -118.254488,
                        34.044874
                    ],
                    [
                        -118.255105,
                        34.044825
                    ],
                    [
                        -118.255169,
                        34.045556
                    ],
                    [
                        -118.254488,
                        34.045442
                    ]
                ],
                "type": "LineString"
            },
            "type": "Feature"
        }
    ],
    "type": "FeatureCollection"
}

Here is how the above response looks. Notice a smaller polygon appears within the large one when we set denoise to a low value. This smaller polygon encloses the area that can not be reached by a truck within 20 minutes from the starting point.

isochrone example 1

API Query Limits

  • Only one of contours_meters or contours_minutes should be provided in the input request. A 400 error is returned if none of them are provided. We do not recommend using both contours_meters or contours_minutes together in a request.

  • Up to 4 isochrones can be requested using the contours_minutes parameter with a maximum allowed value of 40 minutes.

  • Up to 4 isochrones can be requested using the contours_meters parameter with a maximum allowed value of value of 60000 meters.

  • NextBillion.ai allows a maximum rate limit of 6000 queries per minute or 100 queries/second for continuous requests. Note: We can increase the quota if needed, on request. Contact [email protected] for more details.

API Error Codes

Response CodeDescriptionAdditional Notes
200Normal success case.

Normal success case.

400Input validation failed.

Such as missing parameter or parameter with invalid value type (for example value cannot be parsed into number).

401APIKEY not supplied or invalid.

This error occurs when the wrong API key is passed in the request or the key is missing altogether

403APIKEY is valid but does not have access to requested resources.

You might be querying for a geographical region which is not valid for your account, or requesting a service which is not enabled for you.

404Requested host/path not found.

This error occurs when there is a malformed host name used.

422Could not process the request.

There is an underlying map issue which prevents the processing of the request.

429Too many requests.

QPM reached or API request count quota reached.

500Internal Service error.

There was an internal issue with NextBillion.ai services. You can reach out to [email protected] for an explanation.